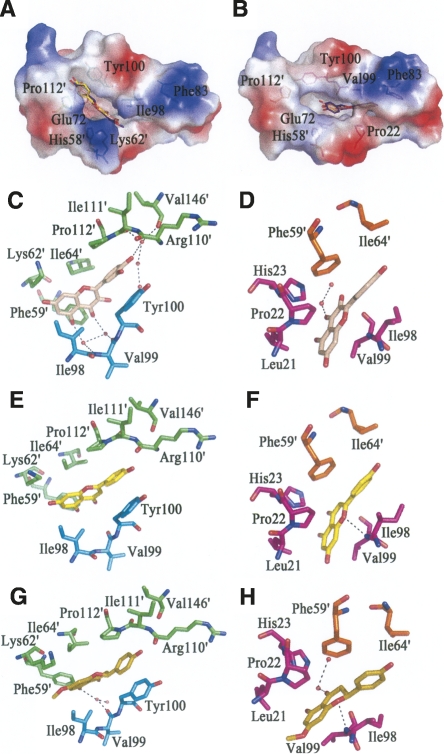
Figure 3.
The interaction between HpFabZ and inhibitors. (A,B) Binding positions of quercetin (salmon), apigenin (yellow), and (S)-sakuranetin (purple-blue) around the tunnel entrance (model A) or near the catalytic residues (model B) are shown. In model A, the inhibitors bind to the entrance of tunnel B linearly through hydrophobic interactions and are stacked between residues Tyr100 and Pro112′. In model B, inhibitors embed into tunnel C near the catalytic residues and are located in the hydrophobic pocket. The electrostatic surface of the active tunnel is rendered by a color ramp from red to blue. (C–H) Quercetin colored in wheat (C,D), apigenin colored in yellow (E,F), and (S)-sakuranetin colored in olive (G,H) interact with surrounding residues and water molecules in HpFabZ. Hydrogen bonds are shown as black dashes. Residues are labeled and colored in green, cyan, magenta, and orange for monomers A, B, C, and D, respectively.

