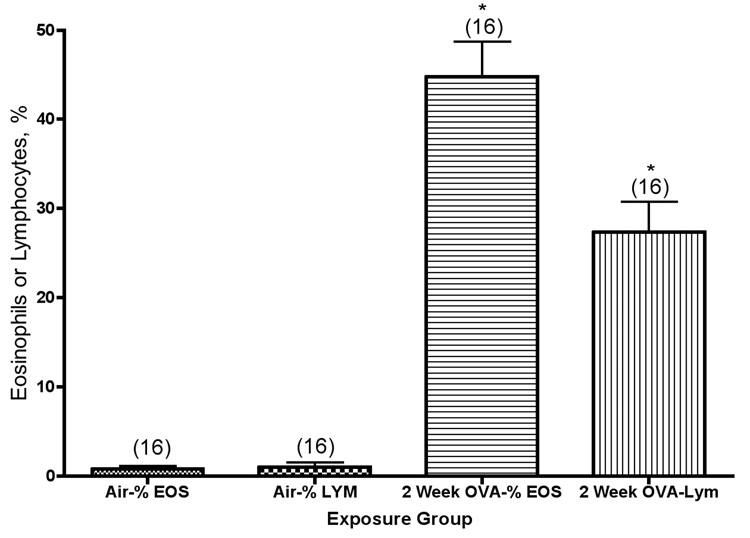
Figure 1.
Eosinophil (Eos) and lymphocyte (Lym) percentages in the lung lavage fluid from Balb/c mice exposed to ovalbumin aerosol for 2 weeks. *, significantly higher than the corresponding air group (P<0.001). The values shown on the graph are group mean percentage of total cells ± SE, with experimental group size, N, represented as a bracketed number above the bar.

