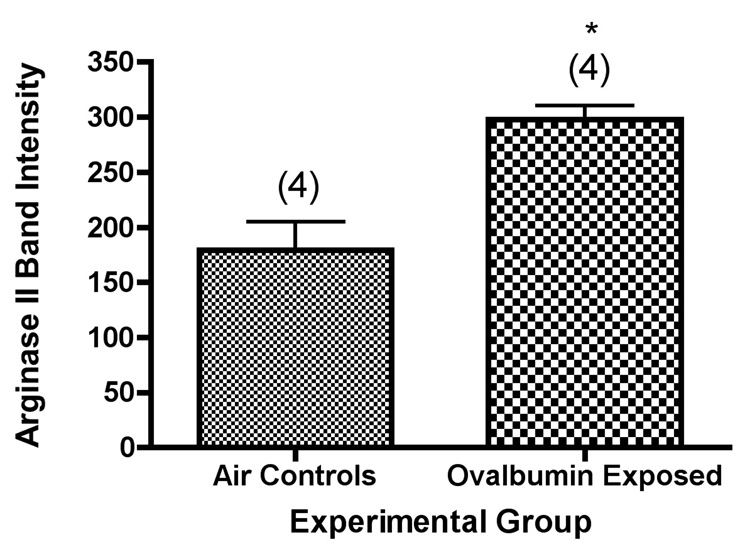
Figure 5.
Arginase II content of isolated airways from Balb/c mice exposed for 0 or 2 weeks to ovalbumin aerosol. *, significantly greater than air control (P=0.006). Values shown on the graph are group mean intensity ± SE, with experimental group size, N, represented as a bracketed number above the bar.

