
Figure 3. In Vivo Imaging of Glutamate-evoked Ca2+ transients.
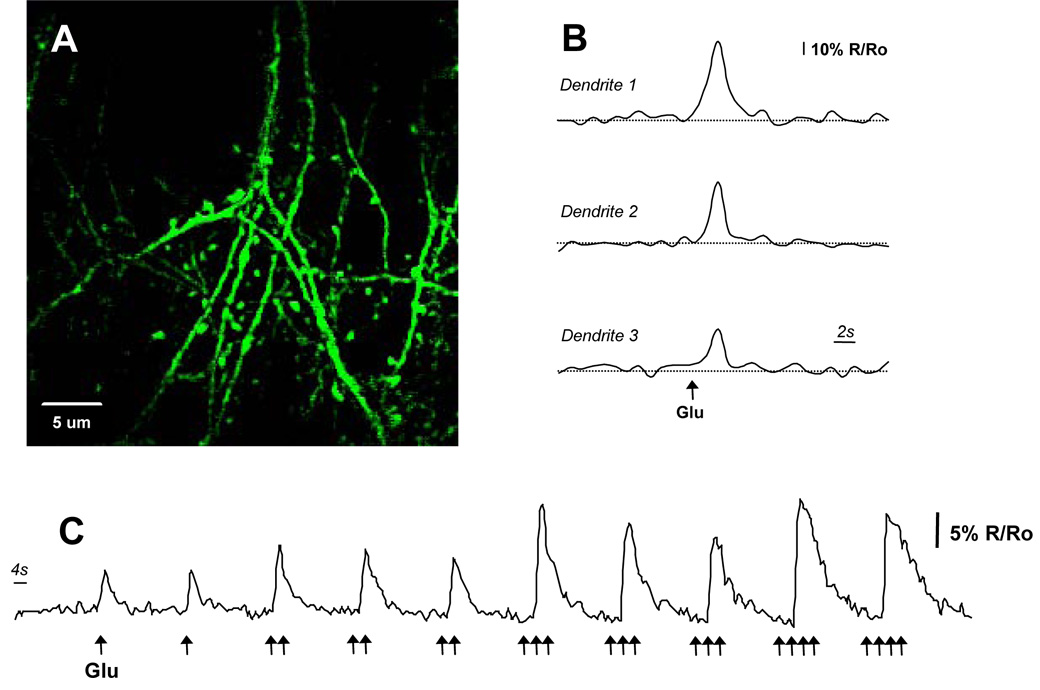
A) High-resolution multiphoton image of dendrites and spines in vivo. The calcium response to micropipette injections of glutamate is described in trace (C). B) Dendrites from three different animals showing responses to small puffs of glutamate (10 mM). Calcium transients were measured as ΔR/R and averaged 56% ± 1% (n=16 dendrites). C) Peak calcium response and the decay constant increased with increased glutamate. Local glutamate concentration was approximated by co-injecting a red-fluorescent synthetic dye.