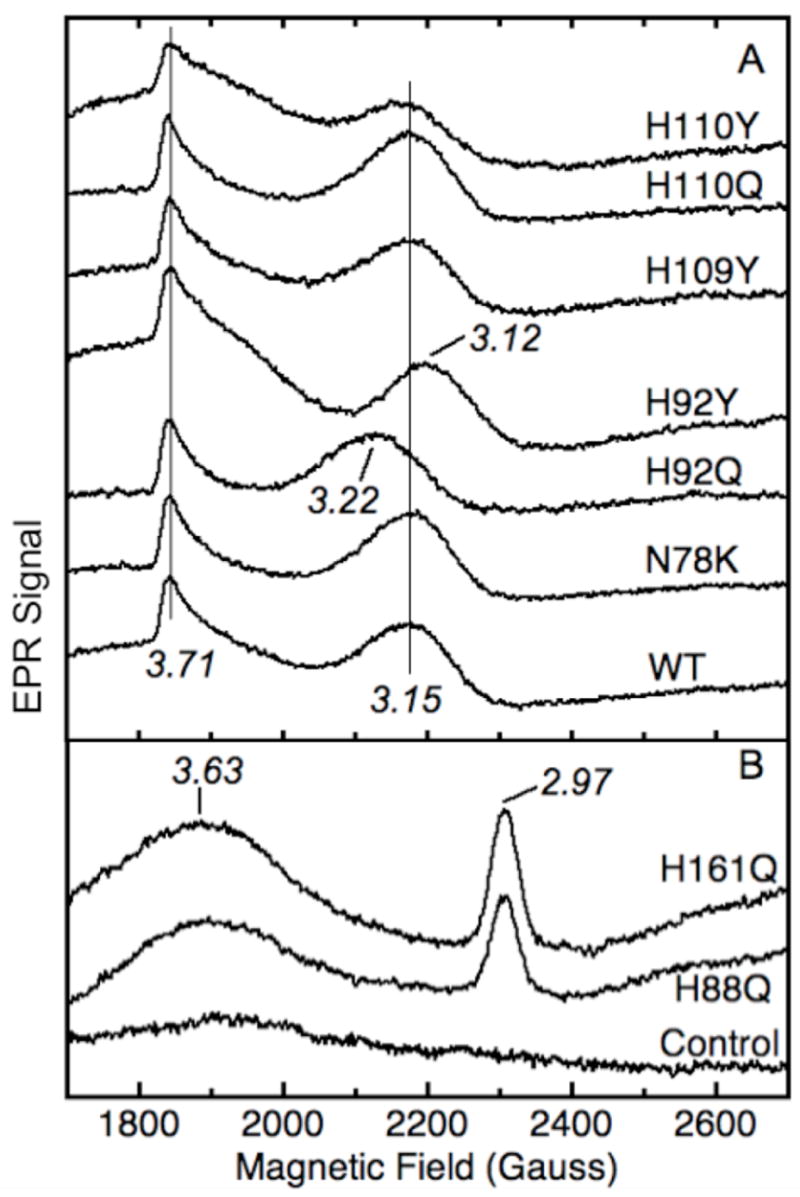
Figure 4.

EPR spectra of low spin signals from purified wild type and mutant cyt b561. Panel A: homogeneous samples of wild type (WT, 143 μM heme), N78K (163 μM heme), H92Q (118 μM heme), H92Y (132 μM heme), H109Y (112 μM heme), H110Q (155 μM heme) and H110Y (106 μM heme). The signal amplitudes are normalized to the heme concentration and the g values are indicated. Panel B: partially purified samples of H88Q (69 μM heme, 8.7 mg total protein/mL), H161Q (61 μM heme, 9.3 mg total protein/mL), and a detergent extract from control membranes subjected to the same purification protocol (8.2 mg total protein/mL). The spectrometer conditions were: frequency, 9.60 GHz; modulation amplitude, 10.9 G; power, 4.0 mW; and temperature, 4 K.
