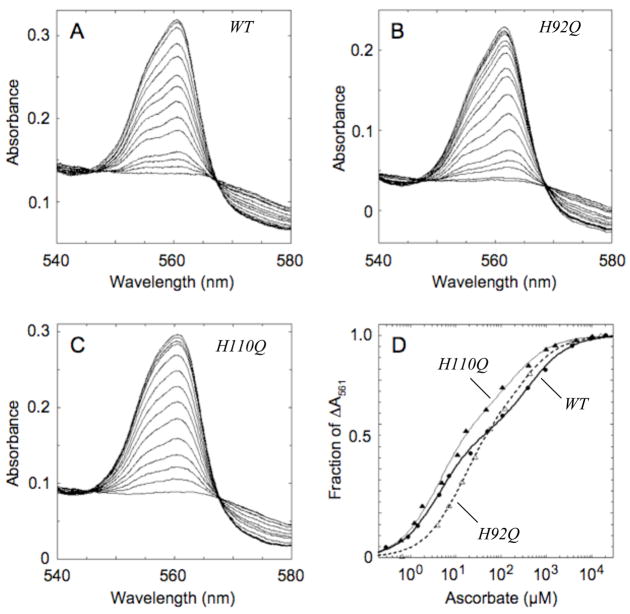
Figure 5.
Ascorbate titrations of recombinant cyt b561. Optical spectra were recorded during individual ascorbate titrations of wild type cyt b561 (A; 7.8 μM heme) and the H92Q (B; 7.8 μM heme) and H110Q (C; 9.4 μM heme) mutants. The fractional increases in A561 are plotted as a function of the ascorbate concentration in panel D for wild type (WT; filled circles), H92Q (open triangles) and H110Q (filled triangles). The lines are the non-linear regression fits to the equation given in Table 3.

