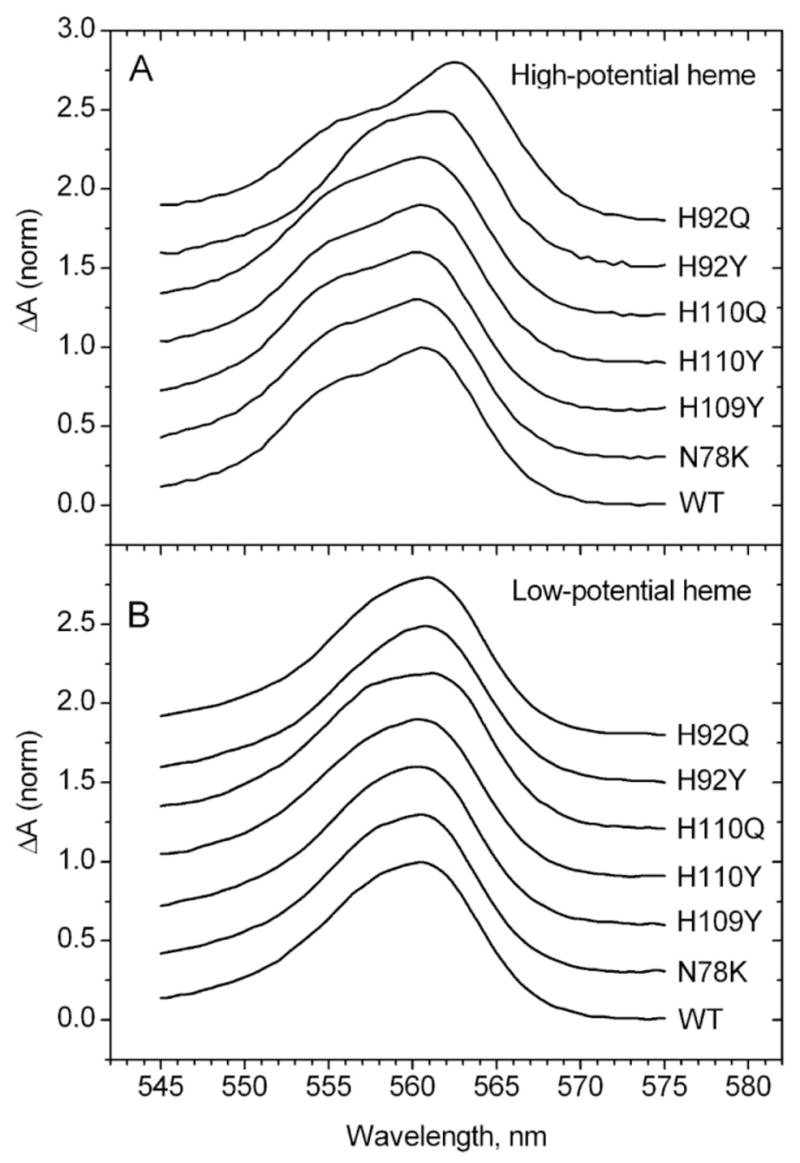
Figure 6.

Alpha band difference spectra of high-potential (A) and low-potential (B) heme centers of wild type and mutant cyt b561 proteins obtained from ascorbate titrations. Each spectrum for the high potential heme was obtained by averaging the differences in three pairs of spectra from early points in the titrations (e.g., for wild type: Fig. 5A #5 - #1, #6 - #2, #7 - #3). Each spectrum for the low potential heme was obtained by averaging the differences in three pairs of spectra from later points in the titrations (e.g., for wild type: Fig. 5A #15 - #10, #14 - #9, #13 - #8).
