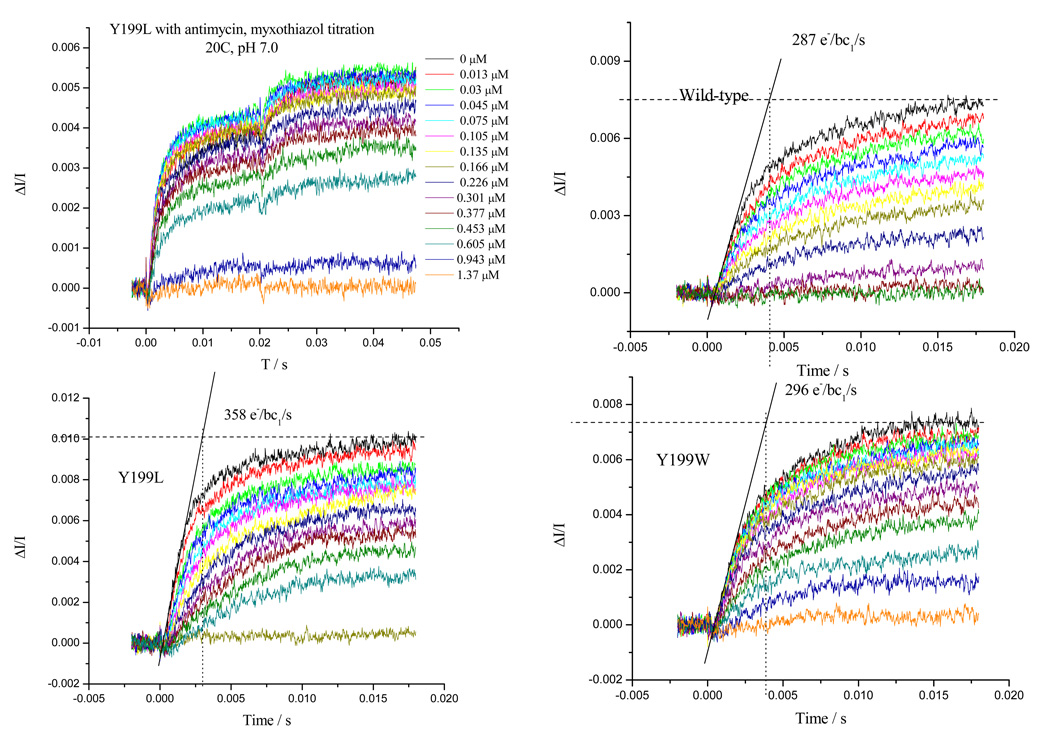
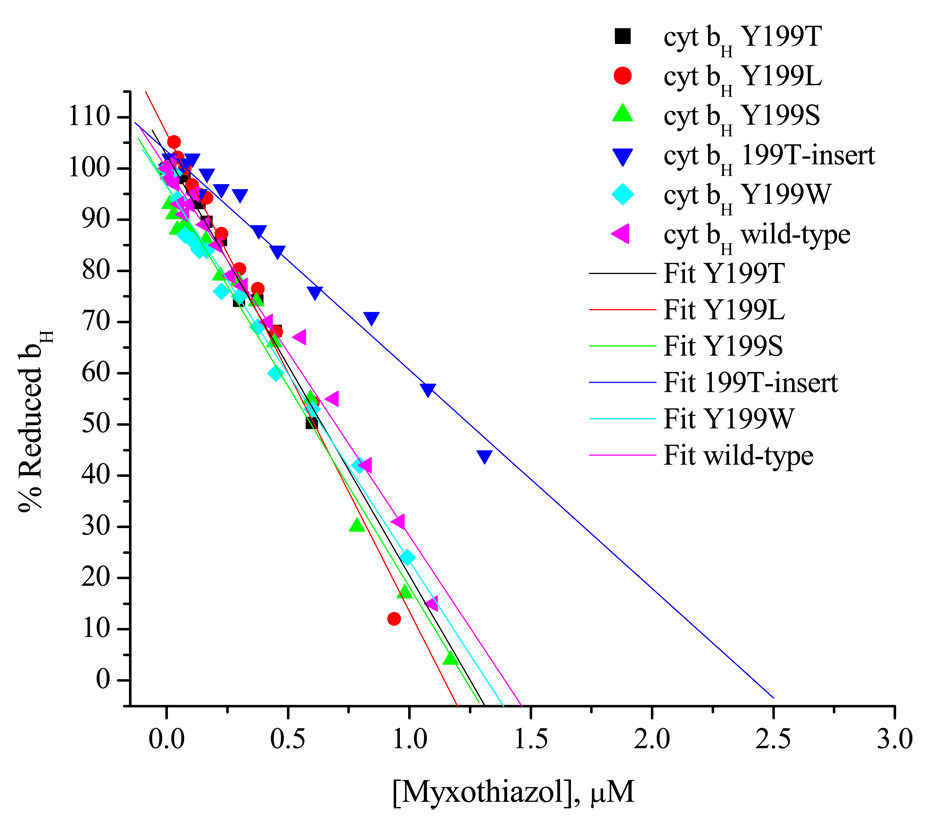
Fig. 4. Titrations of Qo-site with myxothiazol showing linear curves in WT and mutant strains.
a) Typical curves showing the kinetics of heme bH reduction in WT in the presence of antimycin. Similar sets of data were taken for each strain, all of which had similar maximal rates. Myxothiazol concentrations are indicated to the right of each curve. b) Fraction of heme bH reduced at 20 ms (expressed as %) in the presence of Qi-site inhibitor antimycin A, as a function of inhibitor concentration. The system was excited with a xenon flash (~5 µs at half-height) and the reduction of bH monitored from the difference kinetics measured at 561–569 nm. Ambient redox potential was poised at ~100 mV (QH2 oxidation close to maximal). Strains are indicated by labels; bc1 complex in the range 70–220 nM.


