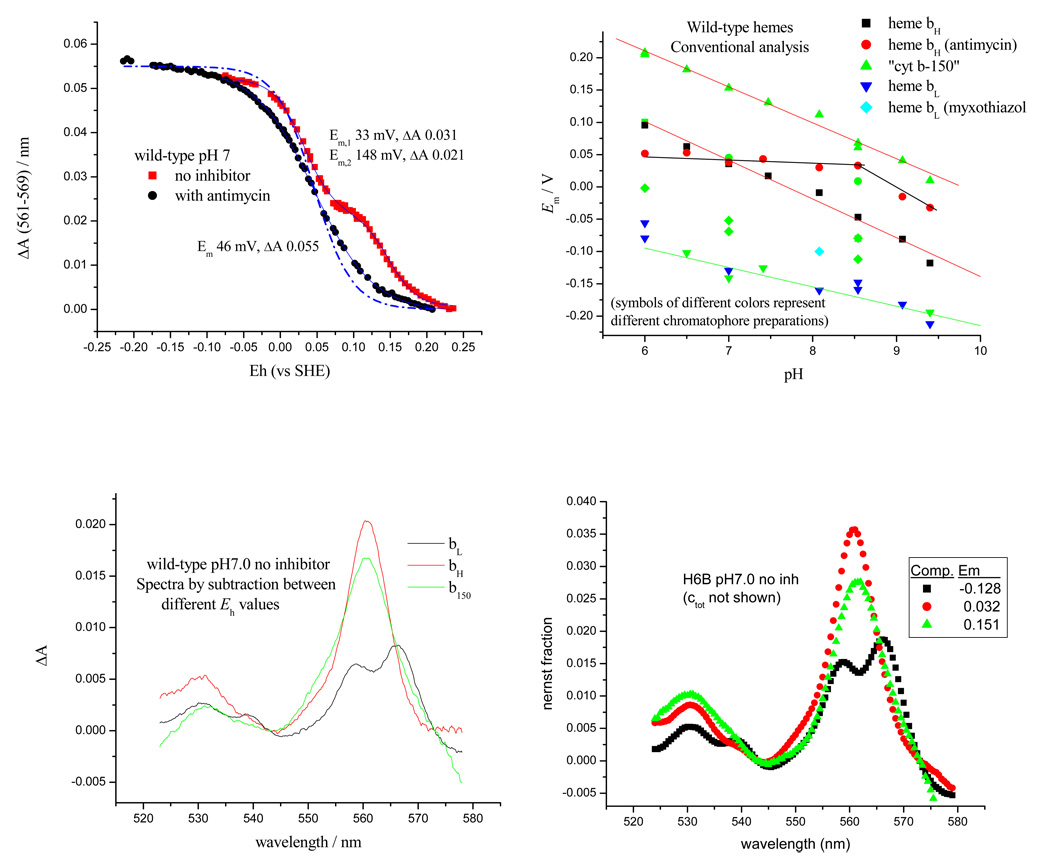
Fig. 6. Thermodynamic behavior of the b-type hemes in H6B strain (his-tagged cyt b with wild-type sequence) in situ.
(Top left) typical titration data in the absence and presence of antimycin (pH 7); (bottom left) spectra from redox cuts showing cyt b150, heme bH and heme bL; the dashed line shows the curve expected for an n=1 component, with amplitude for degree of reduction plotted as (Bottom, right) spectra derived by fitting titrations at each wavelength using fixed values for Em, and n, for each component; (top, right) the pH-dependence of Em values for individual components, assuming single species for each component.

