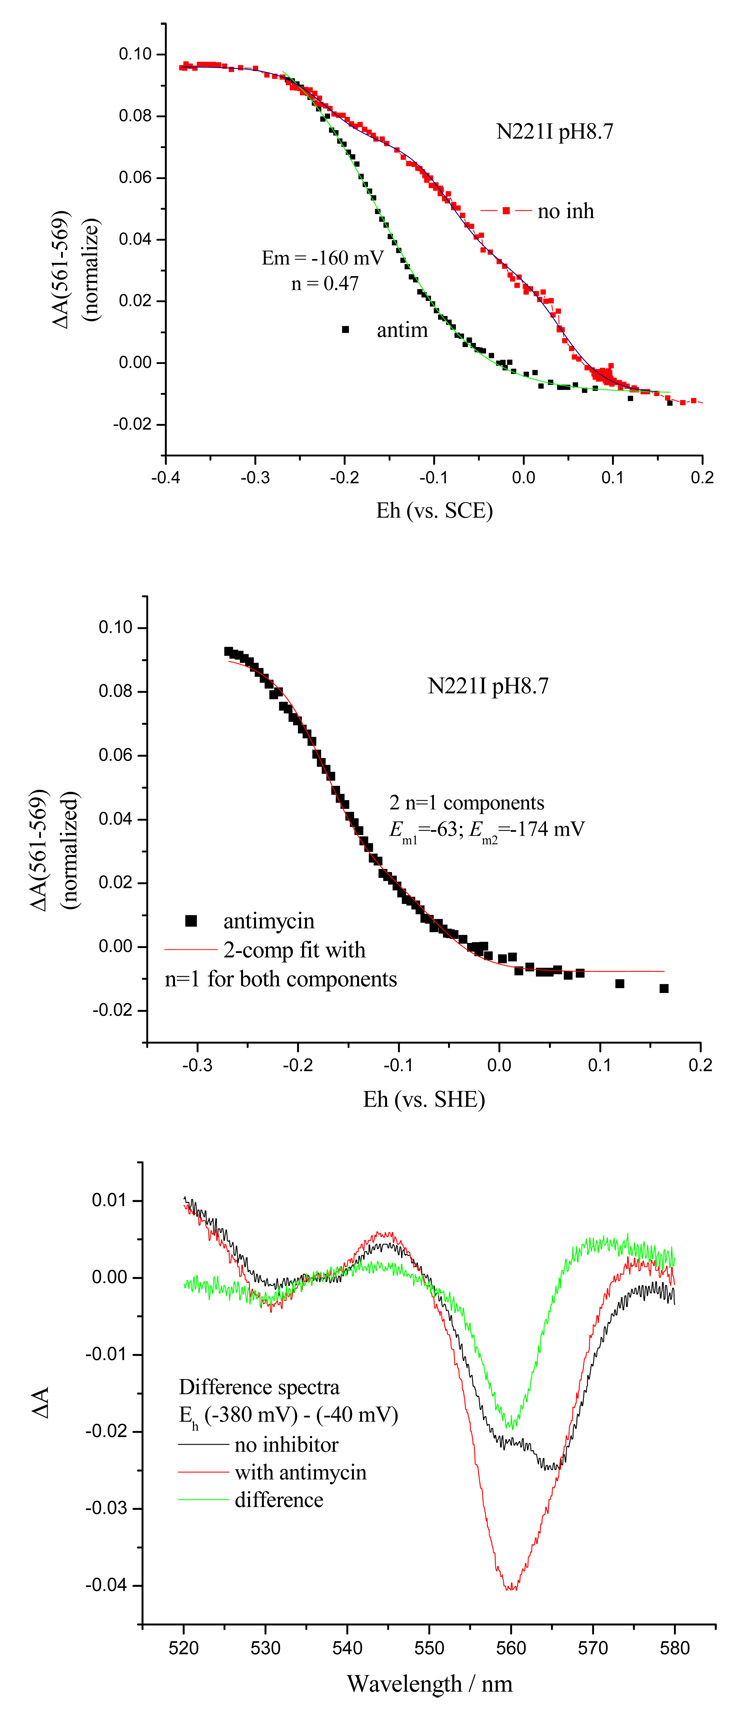
Fig. 8. Titration of heme bH in chromatophores from N221I in the presence and absence of antimycin.
A (top), titration curves showing shift in Em on addition of antimycin; B (middle), titration with antimycin fit by 2-component, n=1; C (bottom), absorbance spectra showing the difference (−380)-(−40) mV from pH 8.7 titration. The difference with and without antimycin shows the contribution of heme bH with its low potential in the presence of antimycin.

