
4. 2.2Hz power and coherence.
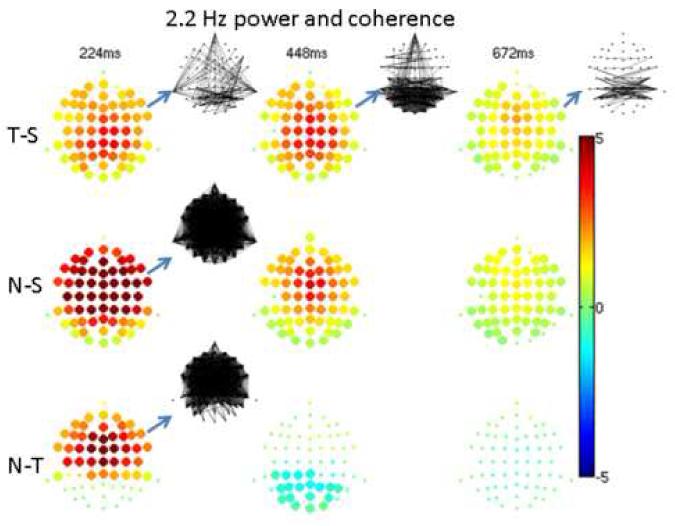
High frequency resolution (2.2Hz bandwidth) analysis at the lowest frequency of 2.2Hz. The fractional difference in power between conditions in overlapping 448ms windows is shown by balls at the scalp electrode locations with fractional values shown in color. Large ball sizes denote significant differences. At the blue arrows, significant differences in coherence are shown by lines connecting electrode locations, with positive differences shown by black lines (no significant negative differences occurred). Differences were taken as target minus standard (denoted T-S), novel minus standard (N-S), and novel minus target (N-T). In determining significance, p-values were corrected for multiple comparisons with a false discovery rate of 0.05.