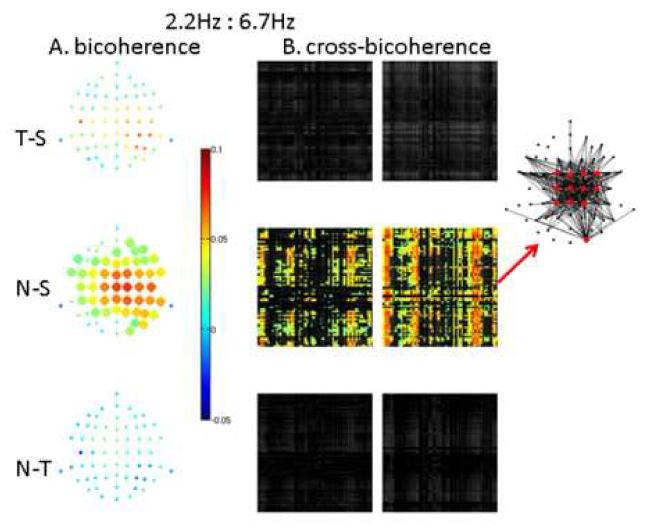
6. 1:3 phase locking. Delta:theta bicoherence (A) and cross-bicoherence (B) differences at 0-450ms.

A. Difference in 1:3 phase locking (bicoherence between 2.2 and ∼6.7 Hz) is shown by balls at all electrode locations, with difference values shown in color. Large ball sizes denote significant differences. As in Figures 4 and 5, T-S denotes target minus standard, N-S denotes novel minus standard, and N-T denotes novel minus target. In determining significance, p-values were corrected for multiple comparisons with a false discovery rate of 0.05. B. Difference in cross-electrode 1:3 phase locking (cross-bicoherence between 2.2 and ∼6.7Hz) is shown for all electrode pairs by 62x62 (electrode by electrode) matrices, with 2.2Hz in the row electrode, 6.7Hz in the column electrode, and the sum frequency in the row electrode (left) or column electrode (right). Significant differences are shown in color with the same color scale as in A. In determining significance, p-values were corrected for multiple comparisons with a false discovery rate of 0.05. The columnar structure of the cross-bicoherence matrices shows that theta (6.7Hz) oscillations at a discreet set of locations (predominantly central and parietal regions) couple to a global delta (2.2Hz) oscillation. At the red arrows, the topography of cross-bicoherence is illustrated by lines connecting electrode locations for pairs involving the 12 electrodes (red) with the highest pairwise mean differences.
