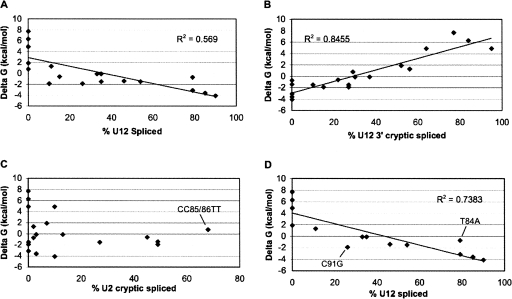
FIGURE 5.
Plots showing the relationship between U12-dependent splicing and U12-dependent branch:anti-branch stability. Free energy values were calculated using the Turner Table nearest-neighbor model (Serra and Turner 1995) to determine the stability of the U12-dependent branch site:U12 snRNA anti-branch interaction for the wild type U12 branch site sequence and each mutated branch site sequence. Free energy estimates were plotted versus the percentage of U12 spliced (A), U12 3′ cryptic spliced (B), U2 cryptic spliced (C), and U12 spliced excluding U2 activators (D). Lines are least-square best fits. R 2 values are as indicated.

