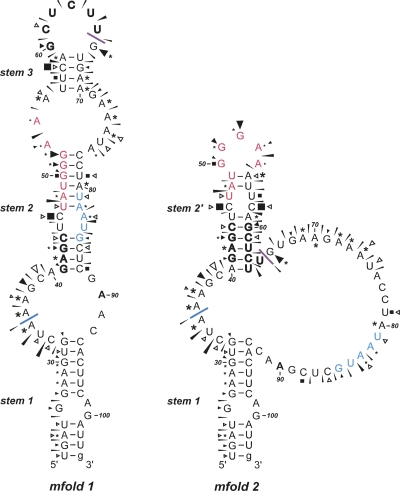
FIGURE 6.
Summary of the BM2 structure probing results. The sensitivity of bases in the BM2 termination–reinitiation region to the various probes is shown for two mfold predictions (see the text). The reactivies of the T1 (black triangle), U2 (asterisk), lead (black slender wedge), CL3 (open triangle), and CV1 (black square) probes are marked. Imidazole cleavage is not marked, but bases resistant to cleavage by this reagent are in bold/outline font. The size of the symbols is approximately proportional to the intensity of cleavage at that site. No structure mapping information was obtained beyond residue A90 (in bold). The stretch of bases in red indicate the 18S rRNA complementary region. Bases that form the stop–start overlap are in blue. The blue line indicates the start of the minimal essential region required for efficient termination–reinitiation. The purple line indicates the likely location of the 5′ edge of a ribosome poised at the termination codon (UAA, in blue). The ultimate 3′ base is in lowercase to indicate that this is a nonviral base of vector origin.

