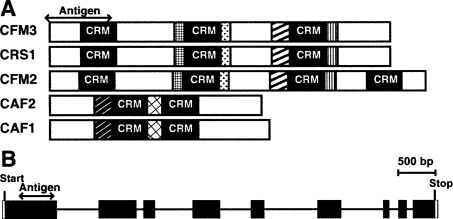
FIGURE 1.
Graphical representations of CFM3. (A) Domain organization of CFM3 and previously characterized CRM-domain splicing factors. CFM3, CRS1, and CFM2 are in the “CRS1” subfamily, whereas CAF1 and CAF2 are in the “CAF” subfamily (Barkan et al. 2007). Regions of high sequence similarity are represented by like shading. There is no discernable sequence similarity between members of the CAF and CRS1 subfamilies outside of their CRM domains. The region used for production of CFM3 antisera is indicated. (B) The ZmCfm3 gene. Exons are shown as rectangles and introns as lines.

