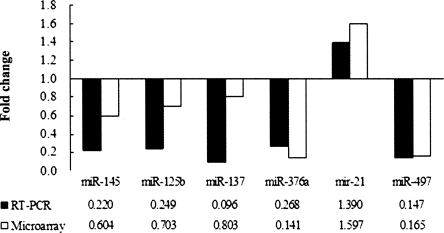
FIGURE 2.
Comparison of miRNA fold changes by miRNA microarray and RT-PCR. The fold change in expression was determined for 60T (BC tissue) in comparison with 1P (corresponding NAT). Microarray fold change was calculated by the ratio of miRNA signal intensities in BRAC versus NAT. RT-PCR fold change is the RPCR value (see Materials and Methods). All of the six comparisons are consistent.

