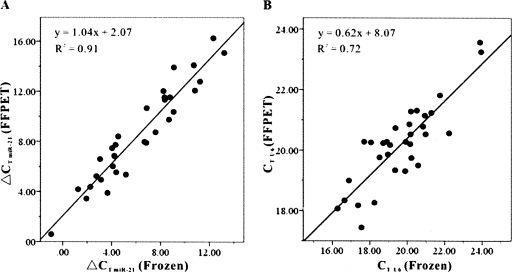
FIGURE 3.
Comparison of miR-21 expression pattern using total RNA extracted from matched samples of FFPETs and frozen tissues. (A) Comparison of ΔCT values of miR-21 assays from paired FFPE and frozen tissue. ΔCT miR-21 = CT miR-21 − CT U6. Identical amount of total RNA was employed in each assay. R 2 is 0.91 between the two kinds of tissues. (B) Comparison of CT values of U6 snRNA assays from paired FFPET and frozen tissue. R 2 is 0.72 between the two kinds of tissues.

