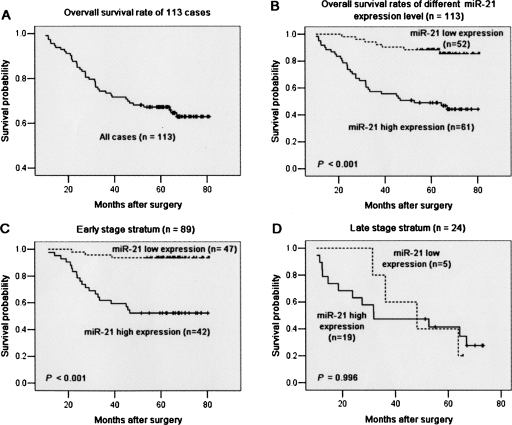
FIGURE 6.
Kaplan–Meier survival curve and log-rank test for BC patients classified as showing either high or low miR-21 expression. (A) Kaplan–Meier curve for 5-yr overall survival rates (64.60%) of 113 patients with BC. (B) High expression of miR-21 (n = 61), group with expression ratio ≥ mean ratio (1.741). mir-21 low expression (n = 52), group with expression ratio < mean ratio. miR-21 expression had a significant (log-rank, P < 0.001) relationship with patient survival. (C) Cases stratified by clinical stage. Within the early stage stratum, miR-21 expression exhibited a significant (P < 0.001; log-rank test) relationship with patient survival. (D) Within the late stage stratum, miR-21 expression did not show a statistical (P = 0.996; log-rank test) relationship with patient survival.

