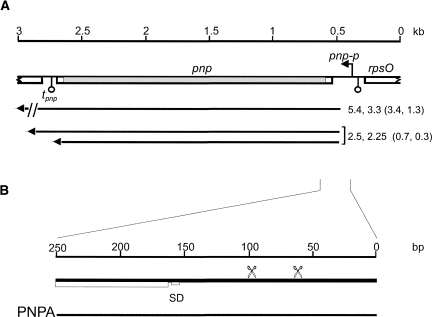
FIGURE 1.
(A) Map of the E. coli pnp region and pnp transcripts. The map of pnp gene and flanking regions is drawn to scale (kilobases on the upper line) based on the annotated E. coli genome sequence (NCBI Accession number U00096.2). (Open boxes) genes; (bent arrow) pnp-p promoter; (hanging balls) transcription terminators. The part of pnp filled in gray is deleted in frame in the Δpnp-751 allele (coordinates of the deletion are 3307070–3309180). pnp+ transcript are reported under the map and their length is indicated in kilobases (Zangrossi et al. 2000); in brackets are the length (in kilobases) of Δpnp-751 transcripts corresponding to monocistronic (0.3 and 0.7) or polycistronic (1.3 and 3.4) pnp+ RNAs. The length of Δpnp-751 mRNAs was determined by comparison to molecular weight markers and internal standards (rRNAs and transcripts with precisely mapped 5′- and 3′-ends). Their 5′-end was determined by primer extension and, as in pnp+, corresponds to RNase III processing site (coordinates 3309266; data not shown), whereas their 3′-ends were approximately deduced from transcript sizes and, for the 0.3- and 0.7-kb RNAs, confirmed by Northern hybridization with appropriate oligonucleotides. (B) The 5′ portion of pnp primary transcript from pnp-p promoter is scaled up (thick line) and the PNPA RNA substrate (thin line) is shown. (Scissors) RNase III processing sites; (SD) Shine–Dalgarno sequence; (open box) pnp ORF.

