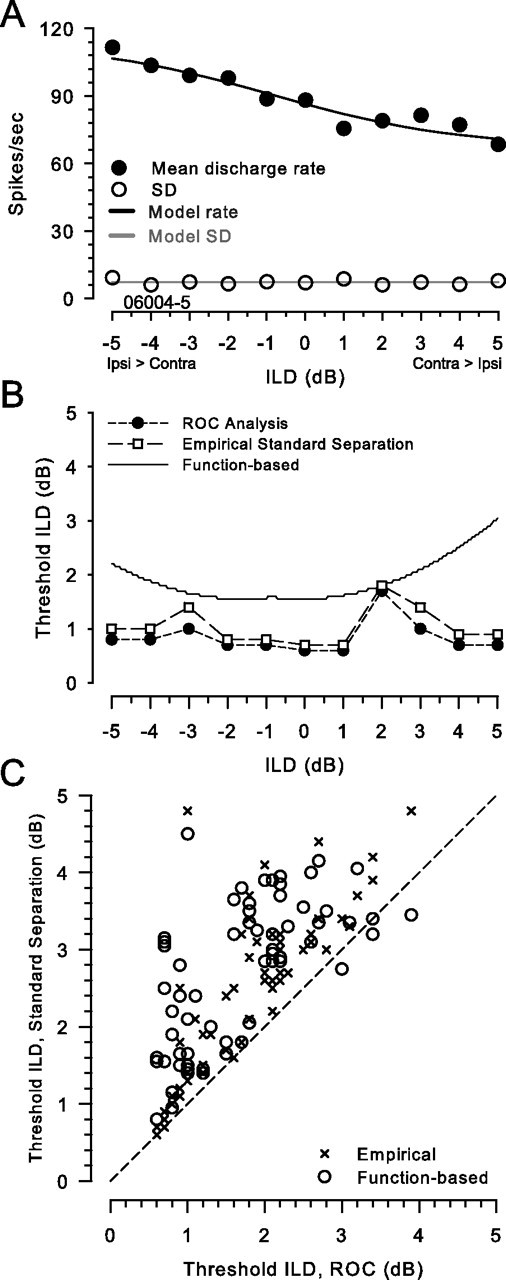
Figure 3.

ROC analysis and standard separation metric yield similar estimates of neuronal threshold ILDs. A, Mean rate (•), SD of rate (○), and model function fits (lines) as functions of ILD for one neuron (CF, 31.1 kHz). Mean and SD of rate are based on 100 presentations of the 300 ms stimulus at each ILD. Symbols and lines are as in Figure 1A. B, ILD thresholds computed by three different methods are shown for the neuron in A. Results from ROC analysis (•) using the response distributions, the standard separation metric (□) using the computed mean and SDs of the response distributions measured at 1 dB intervals of pedestal ILD, and the standard separation metric using mean and variance obtained from the best-fitting functions (line) are shown. Threshold was defined as either the ILD increment or decrement that results in an area under the ROC curve of 0.75 or 0.25, respectively, or a standard separation of 1. C, Thresholds of five neurons at pedestal ILDs from ±5 to 6 dB in 1 dB intervals are shown as a scatter plot (n = 65). Thresholds calculated by the standard separation metric, directly using the empirical distributions (×) or via the function-based approach (○), are plotted against thresholds from ROC analysis. The dashed line is the line of equality.
