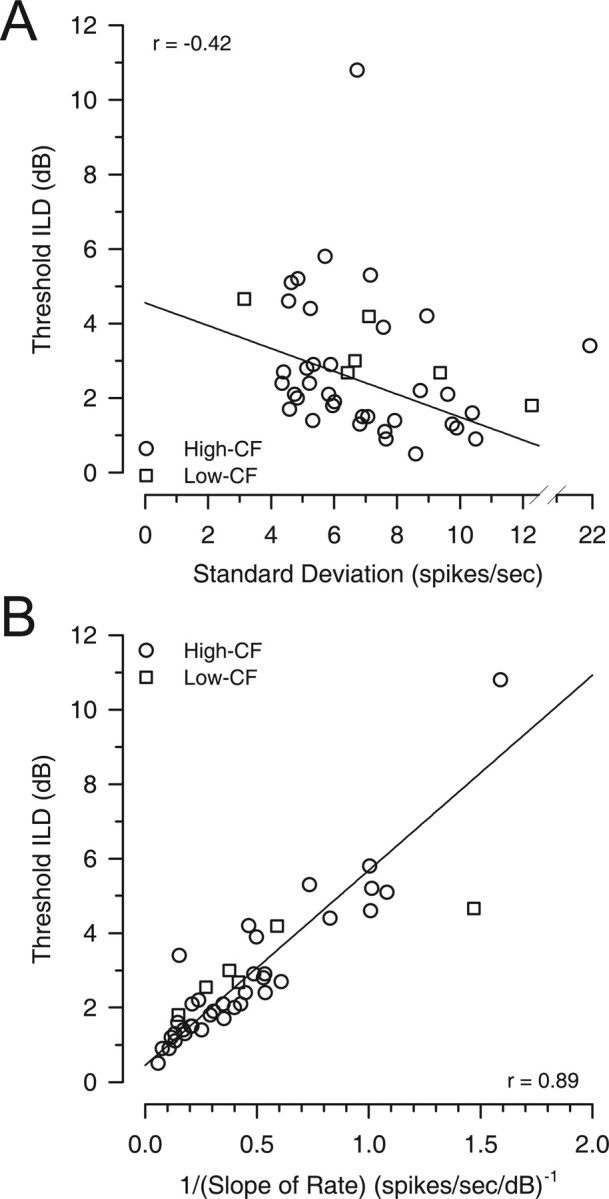
Figure 6.

The neural determinants of the best ILD thresholds. A, The contribution of response variability to threshold ILD was examined by comparing best-threshold ILD as a function of the SD of the discharge rate at the pedestal ILD of best threshold (○, high CF; □, low CF). If response variability was a major determinant of the threshold ILD, then a positive correlation would be expected. Rather, a significant negative correlation was observed (the two obvious outliers were not included in the regression). B, Contribution of the rate of change of the discharge rate with changes in ILD (slope) was examined by comparing best-threshold ILD as a function of the reciprocal of the slope at the pedestal ILD of best threshold (○, high CF; □, low CF). If the slope of the rate was a major determinant of the threshold ILD, then a positive correlation would be expected because a larger change in mean discharge rate (i.e., smaller reciprocal of the slope) results in better discrimination (smaller threshold). A significant positive correlation was observed.
