
Figure 1.
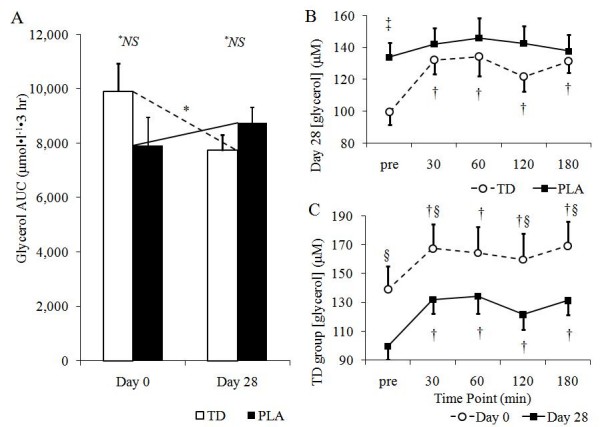
Group glycerol AUC values (A), between group differences in [glycerol] on day 28 (B), and day 0 versus day 28 comparison of [glycerol] in the TD group; all data is expressed as means ± SE; TD, thermogenic drink group (n = 30); PLA, placebo (n = 30); AUC, incremental area under the curve. Sub-figure A: *NS no significant differences between groups, p > 0.05; *significant decrease within TD following 28 days of supplementation, p < 0.05. Sub-figure B: ‡TD < PLA, p < 0.05; †pre-ingestion value < post-ingestion value, p < 0.05. Sub-figure C: §significant difference within the TD group between days 0 and 28, p < 0.05; †pre-ingestion value < post-ingestion value, p < 0.05