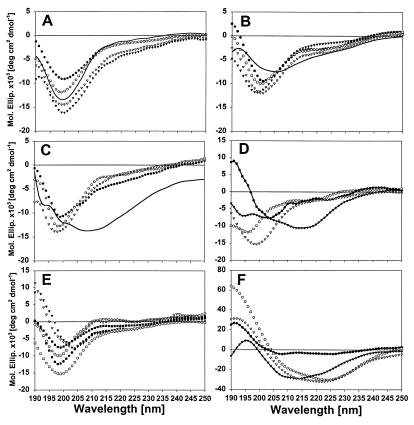
Figure 5.
CD spectroscopy of τ constructs and τ polymers. CD spectra were obtained at 50 μM protein concentrations in 10 mM NH4 acetate at RT, in the absence or presence of 50 μM heparin and/or 50% TFE. (A) hτ23 monomers (circles), dimers (triangles), and assembled PHFs (solid line) show similar CD curves with or without heparin (filled or open symbols). (B) K19 monomers (without heparin, open circles; with heparin, filled circles) and dimers (without heparin, open triangles; with heparin, filled triangles; after aggregation, solid line). (C) PHF43 monomers (without heparin, open circles; with heparin, filled circles) and dimers without heparin (open triangles) and after aggregation (solid line). (D) PHF8 (without heparin, open circles; with heparin, filled circles) and PHF6 (without heparin, open triangles; with heparin, filled triangles). (E) Three peptides derived from PHF43, but not including 306-311 (313VDLSKVTSK321; without heparin, open circles; with heparin, filled circles; 318VTSKCGSLGNIHHKPGGG335 without heparin, open triangles; with heparin, filled triangles; 335GQVEVKSE342, without heparin, open squares; with heparin, filled squares). (F) K19 (open circles) and PHF43 dimers (open triangles) and PHFs (K19, filled circles; PHF43, filled triangles) in the presence of 50% TFE.

