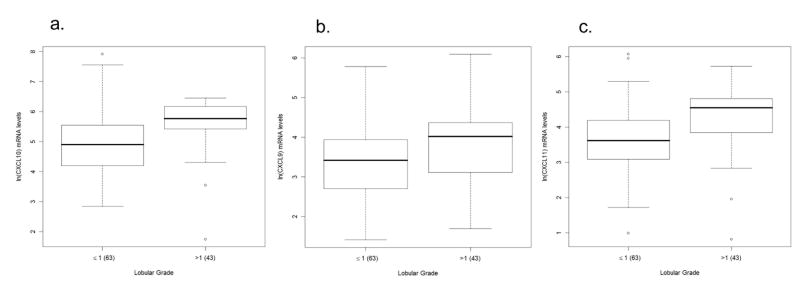
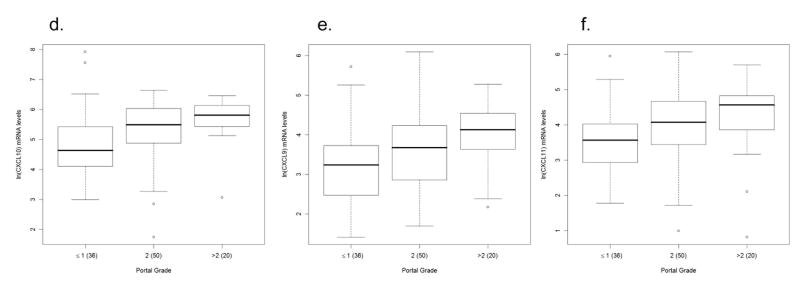
Figure 2.
Association between chemokine expression and inflammation in patients with chronic hepatitis C virus infection. Box and whisker plots illustrating increases in intrahepatic chemokine mRNA levels in patients with minimal/mild (grade < 1) compared to those with mild/moderate (grade > 1) grades of lobular necroinflammation for: a) CXCL10 (interferon γ–inducible protein-10: IP-10), b) CXCL9 (monokine induced by interferon γ: Mig), and c) CXCL11 (interferon inducible T-cell alpha chemoattractant: I-TAC). CXCL10, CXCL9, and CXCL11 levels are significantly (p = 0.0015, p = 0.0241, and p = 0.003, respectively) elevated in those with lobular grade > 1 compared to those with grade ≤ 1. The lower row of box and whisker plots illustrates increased intrahepatic d) CXCL10, e) CXCL9, and f) CXCL11 mRNA levels in patients with increasing grades of portal inflammation. Patients were divided into three strata: minimal/mild (grade ≤ 1), mild/moderate (grade = 2) and moderate/advanced (grade >2). CXCL10, CXCL9, and CXCL11 levels are significantly (p = 0.0106, p = 0.0167, and p = 0.0192, respectively) elevated in those with portal grade > 2 compared to those with grade ≤ 1. CXCL10 levels are also significantly (p = 0.045) in those with portal grade = 2 compared to those with grade ≤ 1. The Y-axis indicates the logarithmic-transformed levels for each chemokine as determined by real-time PCR. The number of patients per group is indicated in parenthesis. Patients with extreme values were the same for all three chemokines. Note different Y-axis values between CXCL10 and CXCL9/CXCL11.


