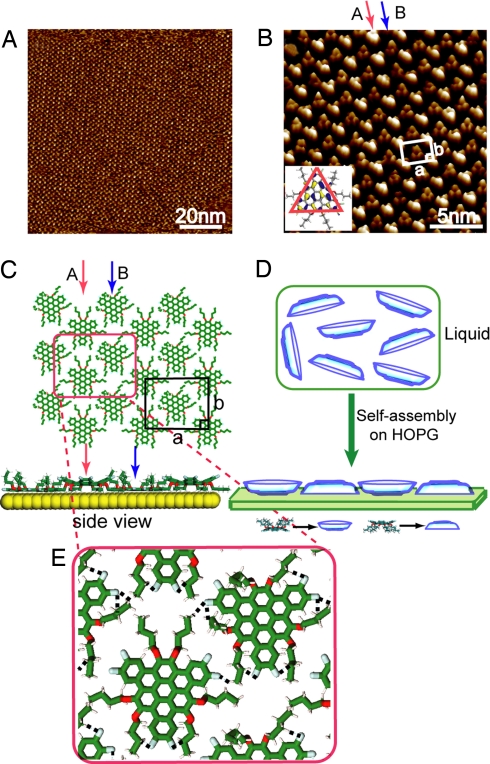
Fig. 2.
Self-assembly of FTBC-C4 on HOPG. (A) Large-scale STM image. Vbias = 650 mV; It = 670 pA. (B) High-resolution STM image. Vbias = 753 mV; It = 674 pA. (Inset) Calculated LUMO of an FTBC-C4 molecule. The arrow A and B in red and blue indicate the “down” and “up” conformation, respectively. (C) Top and side views of the proposed structural model for the ordered FTBC-C4 adlayer. (D) Schematic illustration of “up–down plates” represents the molecular orientation in the self-assembly. (E) Possible hydrogen bonds indicated by black dashed lines.

