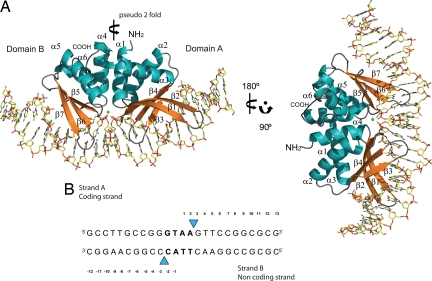
Fig. 1.
Crystal structure of I-DmoI in complex with its target DNA. (A) The protein moiety is colored according to its secondary structure (α-helices are in blue, β-strands are in orange, and loops are in gray), the complex is shown in 2 different orientations. The calcium ion is shown as a green sphere. (B) Oligonucleotide used for crystallization. Throughout the text the individual bases are named with a subindex strandA or strandB indicating the DNA strand they belong to.

