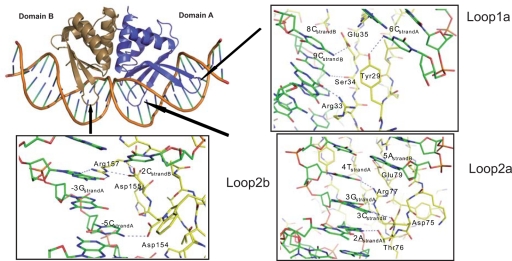
Fig. 3.
Loops involved in DNA binding by I-DmoI. The I-DmoI/DNA complex is shown in diagram representation. Domain A (violet) contains 2 loops that contact the DNA (L1a and L2a) and domain B (green) only has 1 loop (L2b) engaged in contacts with the nucleic acid. L2a and L2b are primarily associated with the central bases of the target site, and L1a is associated with bases outside that region—reflecting the asymmetry of the target recognition by I-DmoI. (Inserts) Close views of the 3 loops involved in DNA interactions. The DNA is colored in green and the protein moiety in yellow; the polar contacts in the protein-DNA interactions are displayed as dashed lines.

