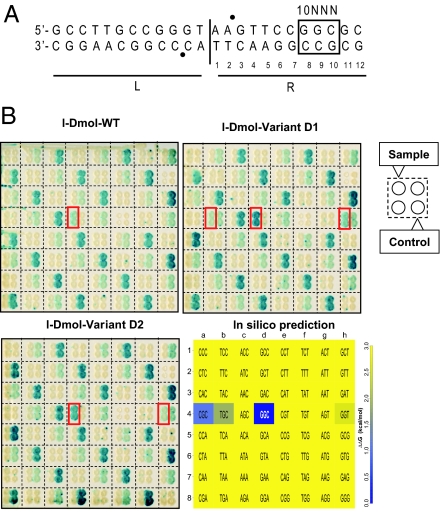
Fig. 5.
In vivo cleavage patterns. (A) I-DmoI recognition site divided in 2 halves, L (Left) and R (Right). Sixty-four targets were derived from the natural I-DmoI target differing only by 3 base pairs at positions 8, 9, and 10 on the R half of the target (R-10NNN). Bullets (●) indicate cleavage positions. (B) Cleavage activities of I-DmoI wild type and of 2 mesophilic I-DmoI variants (D1, D2). The 64 targets are identified in Lower Right by the 5′-NNN-3′ top strand sequence of the nucleotides 8, 9, and 10. The dark blue box is the natural target. (Upper Left) Profile of I-DmoI. (Upper Right) Profile of I-DmoI D1. (Lower Left) Profile of I-DmoI D2. Targets cleaved by the samples are boxed in red. Negative cleavage controls were for mild cleavage: 1a, 1d, 1g, …; medium cleavage : 1b, 1e, 1h, …; and strong cleavage: 1c, 1f, 2a, …. (Lower Right) In silico binding pattern predicted by FoldX. The target triplet is shown inside each cell. For clarity purposes all values >3 kcal/mol are in yellow (see SI Materials and Methods).

