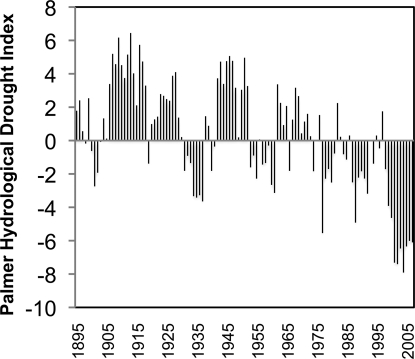
Fig. 2.
Annual PHDI of the Yellowstone Drainage region between 1895 and 2007 (25). Values above zero indicate a wet year, and values below zero indicate drought conditions. Best fit linear model of PHDI values (not shown) has slope = −0.057, adjusted R2 = 0.33, and P ≪ 0.001.

