Fig. 1.
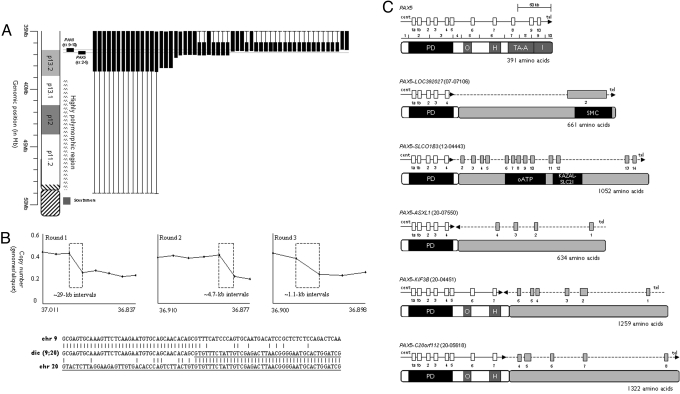
FISH and sequence analysis of BCP-ALL patients with dicentric chromosomal abnormalities. (A) FISH data for chromosome 9 from patients with dicentric chromosomes. A partial idiogram of the short arm of chromosome 9 is shown on the left with the position of the PAX5-specific FISH clone shown in black. Each column shows an individual patient with the position and extent of the deleted region represented by the vertical black box. In several cases, it was not possible to refine the position of the deletion breakpoint (shown by the thin vertical line). This was due either to the lack of uniquely binding FISH clones in the polymorphic region of 9p11–13.1 or lack of material. (B) Representative MCC and sequence analysis of PAX5 disruption in dicentric chromosome translocations. The results from 3 rounds of MCC on patient 20–4551 are shown above, where each round further delineates the position of the breakpoint. The x and y axes show the genomic position and degree of copy number change, respectively. The size and position of the area with the copy number change is shown by the dashed box. Below is the sequence data from the same patient. The fusion sequence is shown between normal sequence for chromosome 9 and 20, where the chromosome 20 sequence is underlined. (C) Schematic of PAX5 genomic breakpoints and partner genes. The exons for PAX5 and the partner genes are shown by the white and gray boxes, respectively. The gene orientation is shown by the horizontal arrow. Below each genomic schematic is the corresponding predicted protein structure and domains. PD, paired; O, octapeptide; H, homeodomain-like; TA-A, transactivation, activating; I, inhibitory; HLH, helix–loop–helix; ETS, Ets; oATP, organic anion transporter polypeptide; KAZAL-ALC21, azal-type serine protease inhibitor; SMC, structural maintenance of chromosomes.

