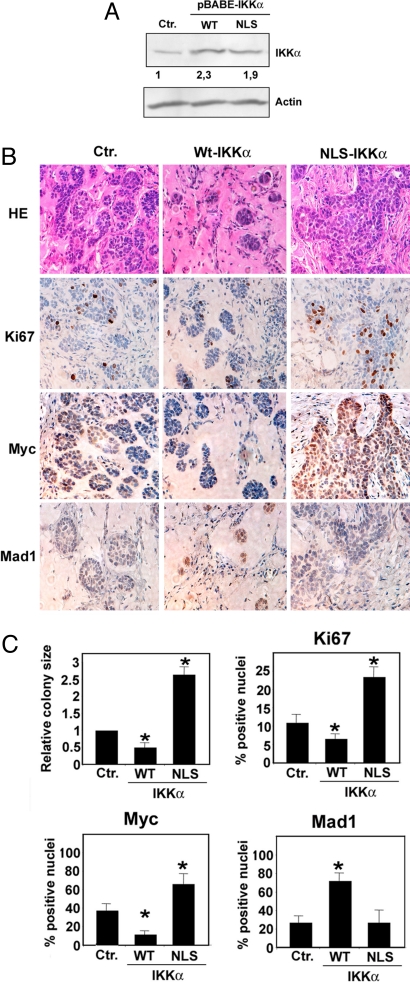
Fig. 6.
IKKα tumor suppressor activity in a mouse xenograft model correlates with Mad1 induction and Myc repression. (A) TE13 cells were infected with either empty (Ctr.) or WT-IKKα-expressing or NLS-IKKα-expressing retroviruses. After puromycine selection, polyclonal cell lines were lysed, and ectopic and endogenous IKKα expression was evaluated by immunoblotting. Relative IKKα expression levels were quantified using the ImageJ program. (B) Polyclonal cell lines (106 cells) were injected s.c. into SCID mice in the presence of 10 mg/ml Matrigel. At day 15, mice were killed and s.c. tumors were subjected to hematoxylin–eosin staining or IHC with specific antibodies to detect expression of Ki-67, Myc, and Mad1. Five mice were injected with each cell line. Representative fields are shown. (Magnification: 40×.) (C) Size of tumor cell colonies grown in Matrigel Matrix was evaluated by Image J software in 3 fields for each tumor. Histogram represents colony size relative to that of mice injected with Ctr.-infected tumor cells. For IHC quantization, positively stained cells were counted in 3 microscopic fields. Histograms indicate percentage of positive nuclei. Error bars represent 1 standard deviation. Asterisk (*) represents statistical significance (P < 0.05) with respect to control as determined by χ2 test.

