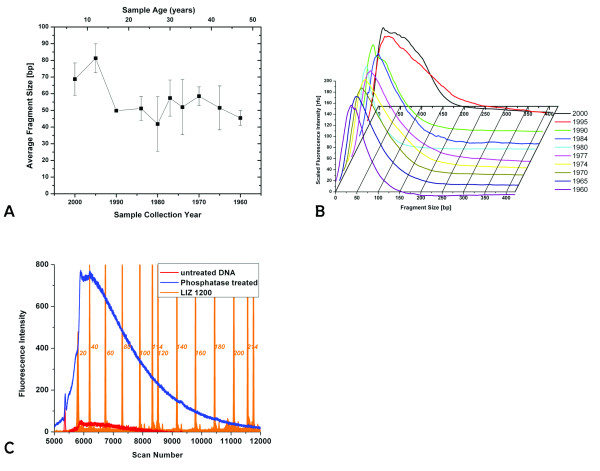
Figure 1.
Panel A shows the size distribution of DNA extracted from moth samples. See methods for details of size determination. Panel B shows the raw data of the FAM-labeled DNA fragments, averaged for each year. Data were scaled to the same height for comparison. Note the decrease in peak width with sample age. Panel C shows the raw data obtained for moth sample 3 from a Capillary Electrophoresis run. Labeling the DNA without any prior treatment results in the fragment distribution shown here in red. An aliquot of the same sample was treated with Antarctic Phosphatase before the TdT labeling reaction, shown in blue. The size distribution of the fragments does not change, while the intensity is increased by a factor of 2–15 for different samples. The LIZ1200 size standard is shown in orange, numbers indicate the fragment size in bases.

