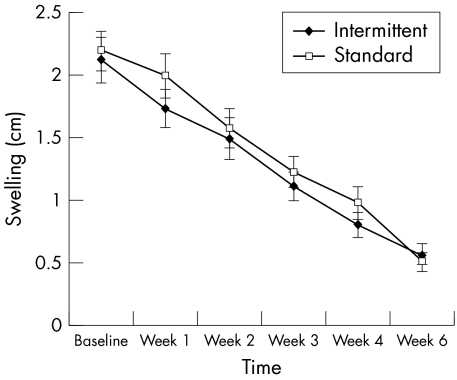
Figure 3 Line graph showing mean (SEM) values for ankle swelling for intermittent and standard groups at baseline and week 1, 2, 3, 4, and 6 after injury. Values for the interaction time × group (within subject factor = time; between subject factor = treatment group): F = 0.839; df = 5; df error = 340; p = 0.523. Sphericity was assumed, as Greenhouse‐Geisser's procedure produced a non‐significant F ratio.

An official website of the United States government
Here's how you know
Official websites use .gov
A
.gov website belongs to an official
government organization in the United States.
Secure .gov websites use HTTPS
A lock (
) or https:// means you've safely
connected to the .gov website. Share sensitive
information only on official, secure websites.
