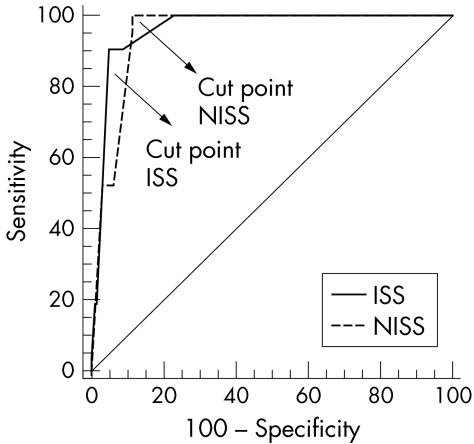
Figure 3 Figure 3 The receiver operating characteristic (ROC) Curves of ISS and NISS for predicting mortality in the whole population (749 patients). There were no significant differences between scores. Cut off points were 22 for ISS (sensitivity 90.5%, specificity 95.4%, AUC 0.962, 95% CI 0.945 to 0.974) and 22 for NISS (sensitivity 100%, specificity 88.7 %, AUC 0.950, 95% CI 0.931 to 0.964).

An official website of the United States government
Here's how you know
Official websites use .gov
A
.gov website belongs to an official
government organization in the United States.
Secure .gov websites use HTTPS
A lock (
) or https:// means you've safely
connected to the .gov website. Share sensitive
information only on official, secure websites.
