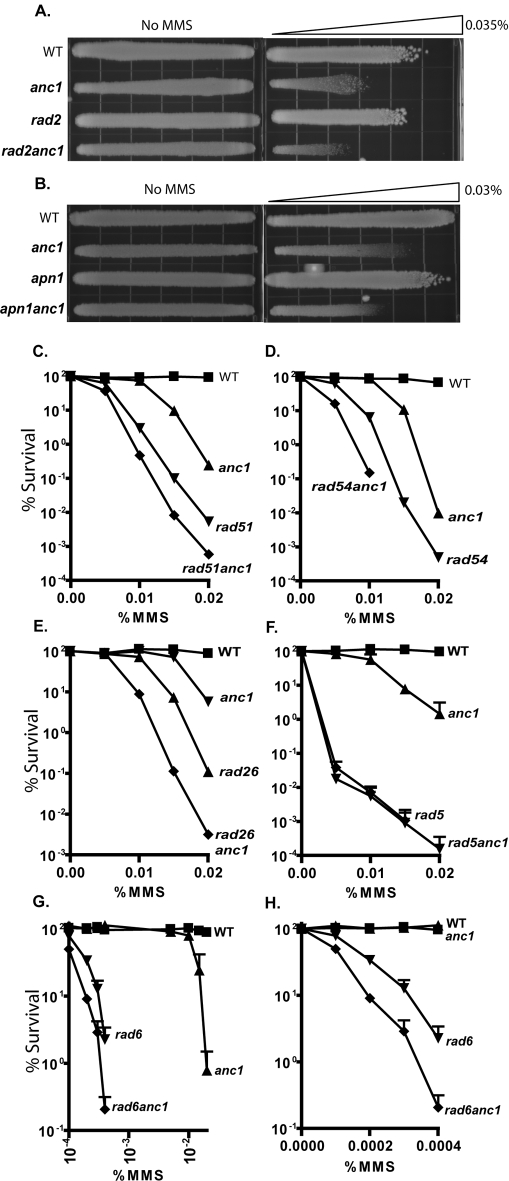
Figure 2. Epistasis analysis of ANC1 in known DNA repair pathways.
Survival after chronic MMS treatment for: A. YPD gradient plate with maximum dose 0.03% MMS, B. YPD gradient plate with maximum dose 0.035% MMS, C. WT (▪), anc1Δ (▴), rad51Δ (▾), rad51anc1Δ (♦). D. WT (▪), anc1Δ (▴), rad54Δ (▾), rad54anc1Δ (♦), E. WT (▪), anc1Δ (▴), rad26Δ (▾), rad26anc1Δ (♦), F. WT (▪), anc1Δ (▴), rad5Δ (▾), rad5anc1Δ (♦). Log-phase cells were diluted and plated on freshly poured MMS-containing YPD-agar plates or onto control plates with no MMS. Colonies were allowed to grow at 30°C for 2–5 days before counting. At least two replicates were counted per trial. Serial dilution and gradient plate replicates available in Figure S2.

