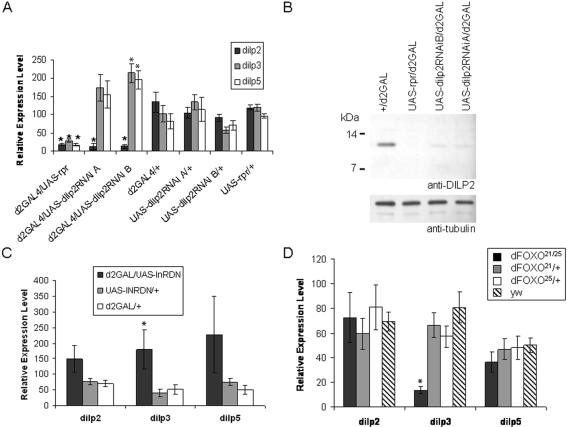
Figure 1. Characterization of DILP2 knock-down in UAS-dilp2RNAi/d2GAL flies.
The effect of UAS-dilp2RNAi driven by d2GAL in the mNSCs on dilp expression in 7 day old adult female heads was measured by quantitative RT-PCR and Western blot analysis. (A) dilp 2, 3 and 5 relative transcript levels in dilp2RNAi/d2GAL and control female heads. (B) Western blot analysis of DILP2 (top panel) or the tubulin loading control (bottom panel) in total head protein extracted from females of the indicated genotype. (C) dilp 2, 3 and 5 relative transcript levels in d2GAL/UAS-InRDN and control female heads. (D) dilp 2, 3 and 5 relative transcript levels in a FOXO null mutant (FOXO21/25) and control female heads. (A, C and D): data are shown as mean relative expression±SEM (N = 5), * denotes significant difference to controls (P<0.05).

