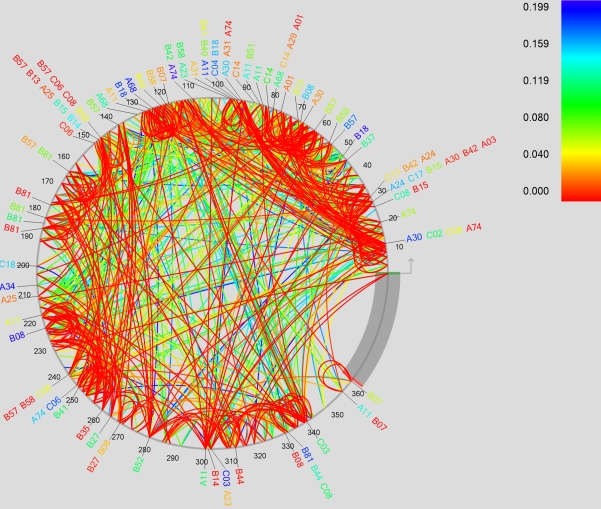
Figure 12. Gag phylogenetic dependency network for combined HOMER and Contract cohorts.
Gag p17 and p24 are drawn counterclockwise, with the N-terminus of p17 at the 3 o'clock position. Arcs indicate association between codons (inside the circle) or between HLA alleles and codons (outside the circle). Colors indicate q-values of the most significant association between the two attributes.

