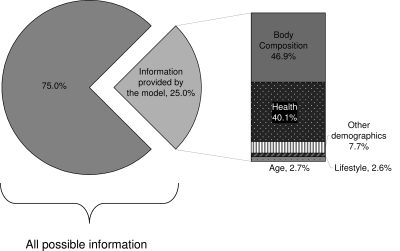
Figure 2.
Information provided by variables in multivariate models for symptomatic AD. The model containing all the relevant variables from submodels accounted for a total of 25.0% of information compared with a theoretical model containing all possible predictors (as measured by the deviance R2).The proportionate contribution of covariate groups are depicted at the right. Covariate groups were added one at a time (from highest contributor to lowest). Of the contributing groups, the body composition group containing the variable for waist circumference was once again the most important.

