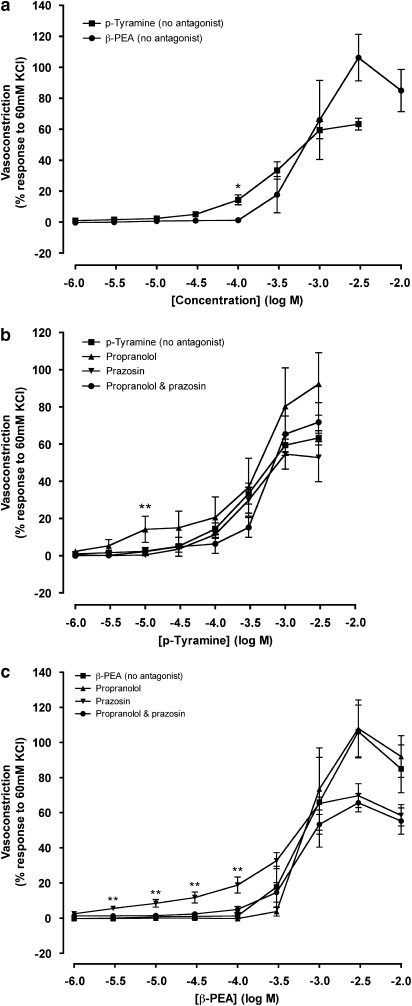
Figure 3.
Concentration–response curves to p-tyramine (a and b) and β-phenylethylamine (β-PEA); (a and c) in the absence (no antagonist) and the presence of prazosin (1 μM) and propranolol (1 μM) constructed in porcine coronary arterial rings with intact endothelium. Data are means±s.e.mean from 5 to 14 separate experiments, expressed as a percentage of the response to 60 mM KCl. When no error bar is shown, the error is smaller than the symbol. *P<0.05 and **P<0.01 indicate significant differences from the control (p-tyramine or β-PEA in the absence of antagonist).

