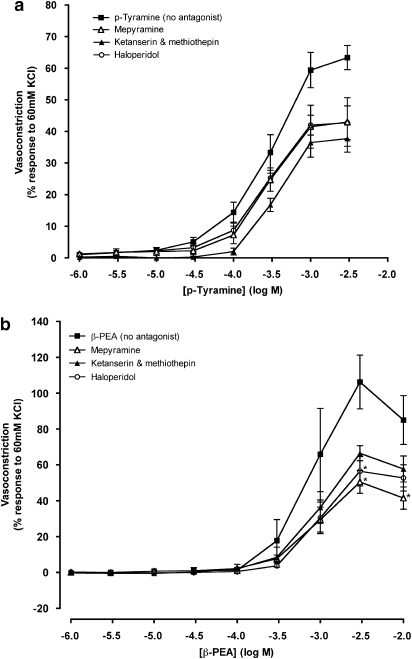
Figure 6.
Concentration–response curves to p-tyramine (a) and β-phenylethylamine (β-PEA; b) in the absence (no antagonist) and the presence of ketanserin (3 nM) and methiothepin (50 nM), haloperidol (0.7 nM) or mepyramine (2 μM) constructed in porcine coronary arterial rings with intact endothelium. Data are means±s.e.mean from 5 to 14 separate experiments, expressed as a percentage of the response to 60 mM KCl. When no error bar is shown, the error is smaller than the symbol. *P<0.05 indicate significant differences from the control (p-tyramine or β-PEA in the absence of antagonist).

