Figure 5.
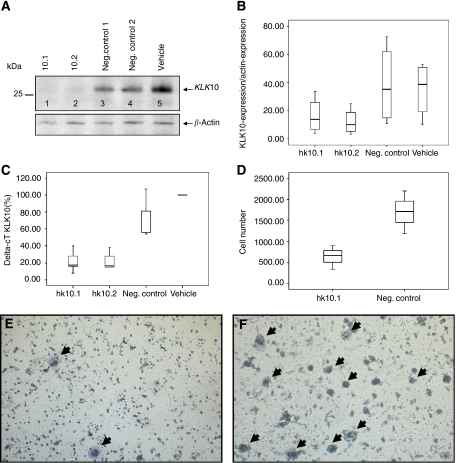
AsPC-1 cells were transfected with two KLK10-sequences, KLK10.1 and KLK10.2. Transfection resulted in a strong downregulation of KLK10 protein synthesis in the western blot. Cell lysates of KLK10.1- and KLK10.2-transfected cells showed nearly no staining (lanes 1 and 2) compared with the controls (lanes 3–5) (A). Statistical analysis showed a statistical downregulation of the transfected group compared with the control group (P=0.025) (B). The same holds true for gene expression in RT–PCR (P<0.001) (C). The Boyden chamber migration assay: Invasion in vitro was measured as described in ‘Materials and methods’. Statistical analysis showed that KLK10.1-transfected cells had a significant decrease in cell motility compared with the controls (P=0.05) ( × 200) (D). Only few KLK10.1-transfected AsPC-1 cells migrated through the membrane (arrow) (E). The control group displayed normal cell migration (arrows) (F).

