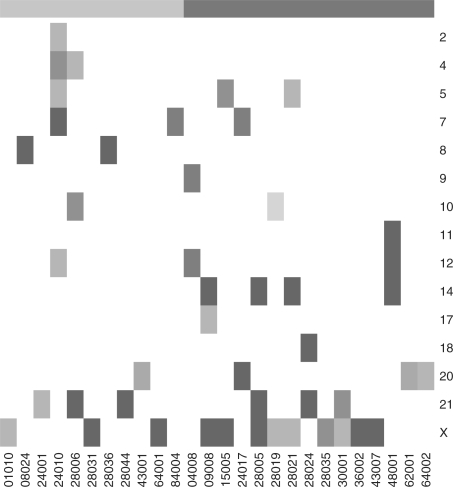
Fig. 5.
Map of suspected aneuploidies in the ALL dataset, by chromosome (rows) and sample (columns). Red–brown hues correspond to extra copies, and blue hues to missing copies. Dark, medium and light shades correspond to FDR levels of 0.05, 0.1 and 0.2, respectively. The top bar indicates hyperdiploidy, as in Figure 2. Samples and chromosomes with no flags have been omitted.

