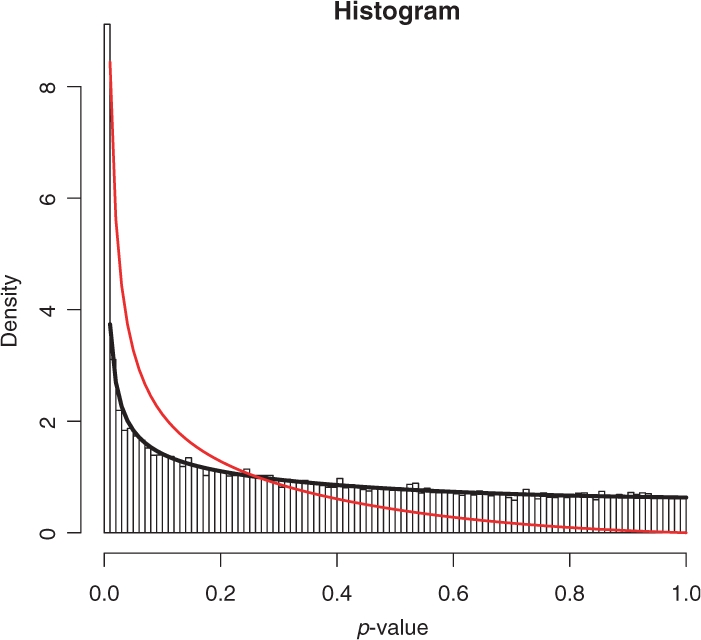
Fig. 2.

Histogram of the P-value distribution of AKT2 knock-down (see Section 3.2). Black: mixture model curve; red: extracted alternative distribution.

Histogram of the P-value distribution of AKT2 knock-down (see Section 3.2). Black: mixture model curve; red: extracted alternative distribution.