
Fig. 2.
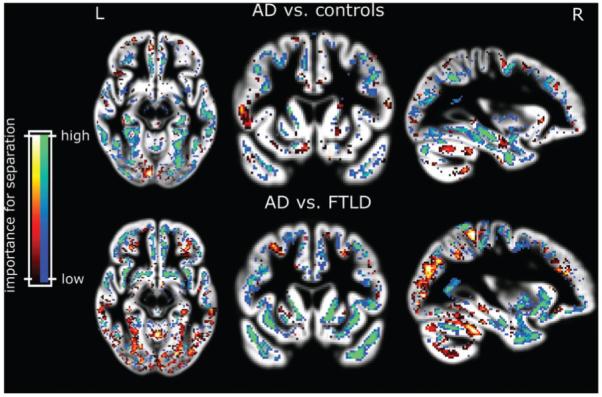
Voxels most relevant for classification of patients from group I after SVM training with the data from group I (upper panel). The blue and green areas indicate higher grey matter volume increasing the likelihood of classification into normal. Red and yellow show regions where higher grey matter volume indicates the opposite. The lower panel depicts relevant areas for the separation from AD from FTLD. Blue and green indicate areas where lower grey matter volume indicates FTLD. Results are overlaid on the mean grey matter compartment image from all subjects.