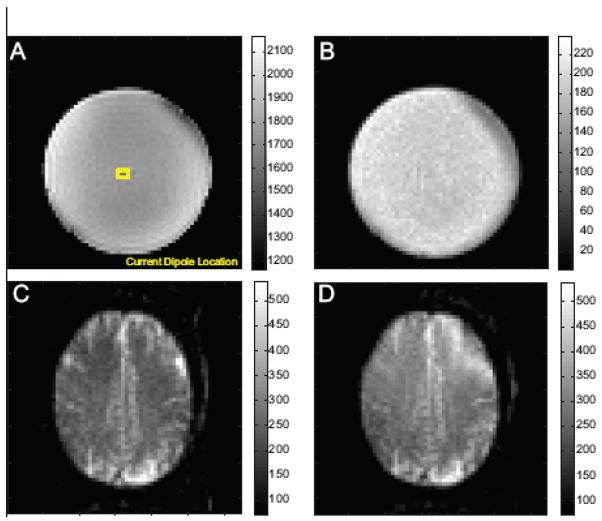
Figure 3.
Representative spin-locked prepped images from the sequence of Fig. 2. A) phantom image spin-locked with γB1lock = 40 Hz shown with the location of the current dipole overlaid in yellow. B) Time series standard deviation from a time series of 420 of the spinlock prepped images. C) Brain image obtained with the spinlock prep sequence with γB1lock = 40 Hz and D) γB1lock = 10 Hz.

