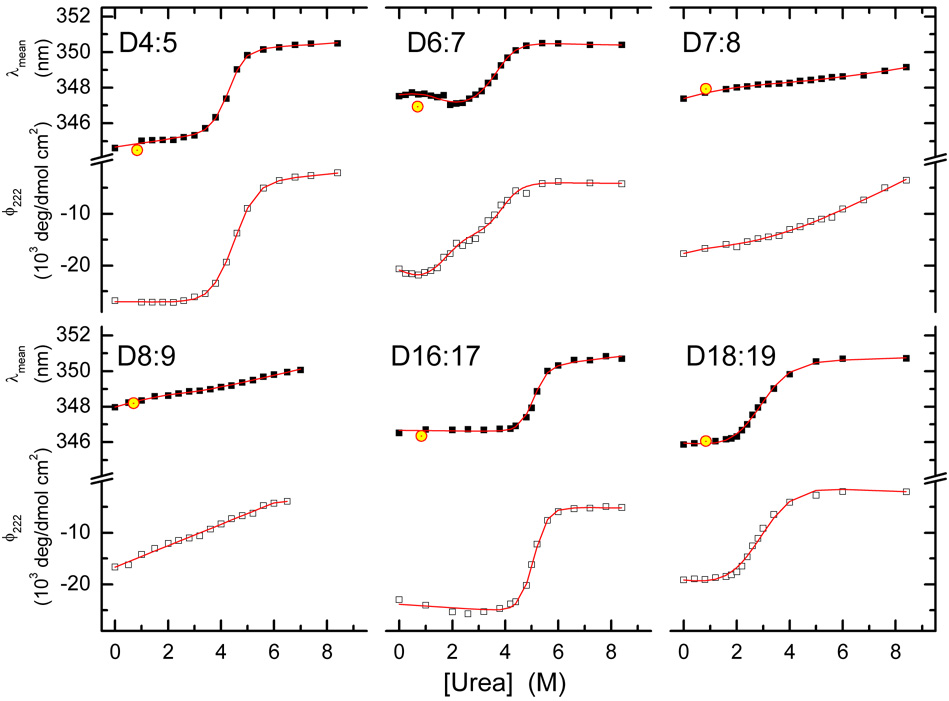
Figure 5. Urea titrations.
Urea denaturation curves were determined by Fluorescence (solid squares and upper traces in each graph) and CD (open squares and lower traces) as described, and fit to appropriate equations as described to determine the thermodynamic parameters ΔG and [Urea]mid, characterizing each transition. Reversibility of the transition was determined by dilution of the last sample at 8.4M urea to 0.84 M (which is well below the transition in each case) and re-measuring the λmean; this is shown by the hollow, yellow circles at 0.84 M.

