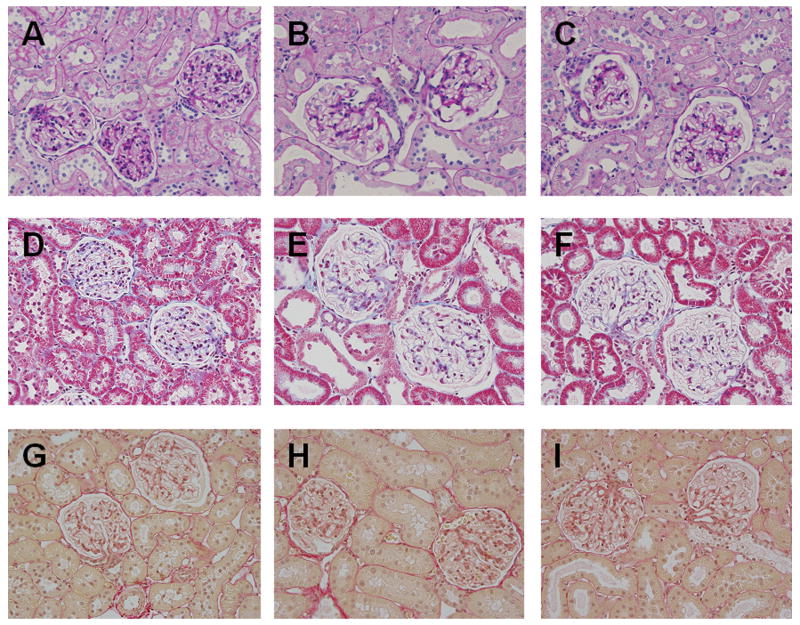
Figure 3.
Representative images of renal histology of Sham (A, D, and G), HG (B, E, and H) and HG+ABT rats (C, F, and I) rats after 10 weeks of treatment (original magnification = 40X). Periodic Acid-Schiff stain (A, B, and C), Gomori’s trichrome stain (D, E, and F), and picro Sirius red staining (G, H, and I).

