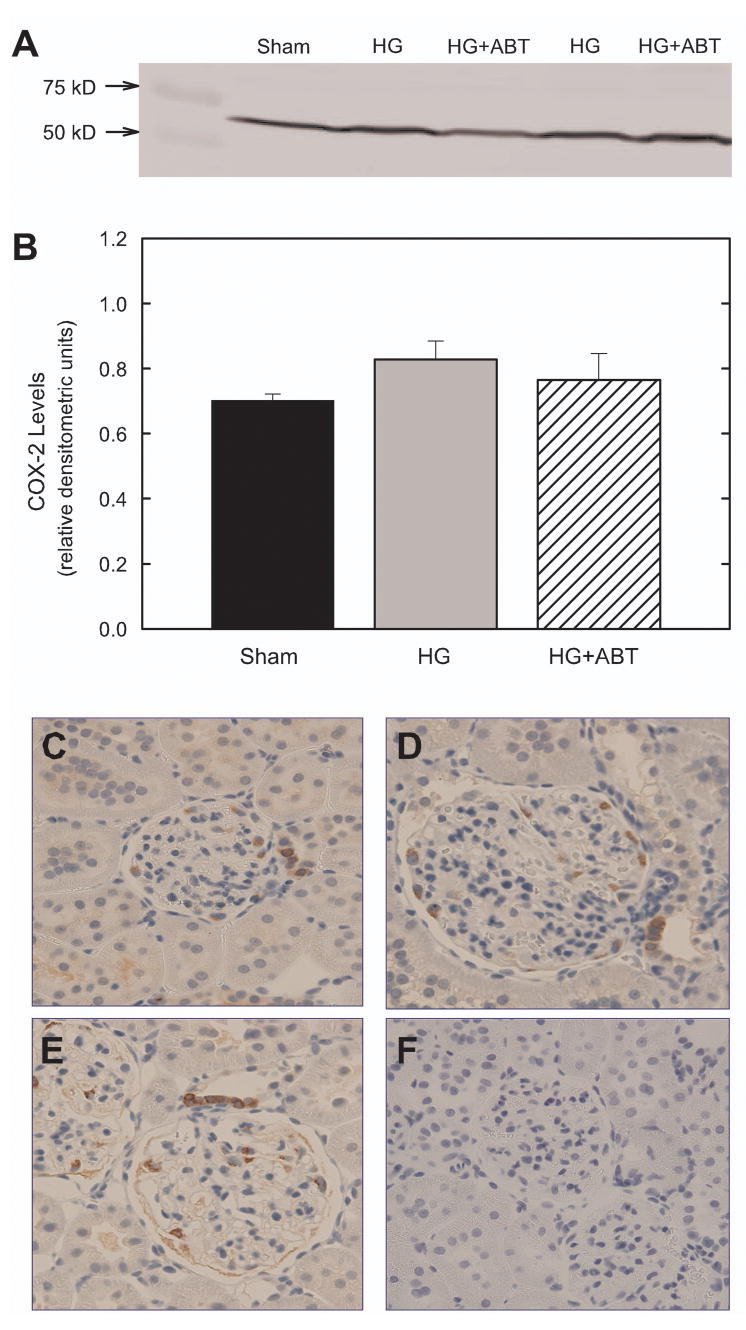
Figure 7.
Renal cortical expression of cyclooxygenase-2.after 10 weeks of treatment. (A) Representative Western Blot. (B) Densitometric analysis (normalized to β-actin). n=5–6. Immunohistochemical localization of cyclooxygenase-2 in the renal cortex of Sham (C), HG (D) and HG+ABT rats (E) after 10 weeks of treatment. Panel F is a negative control (no primary antibody).

