
Fig. 3.
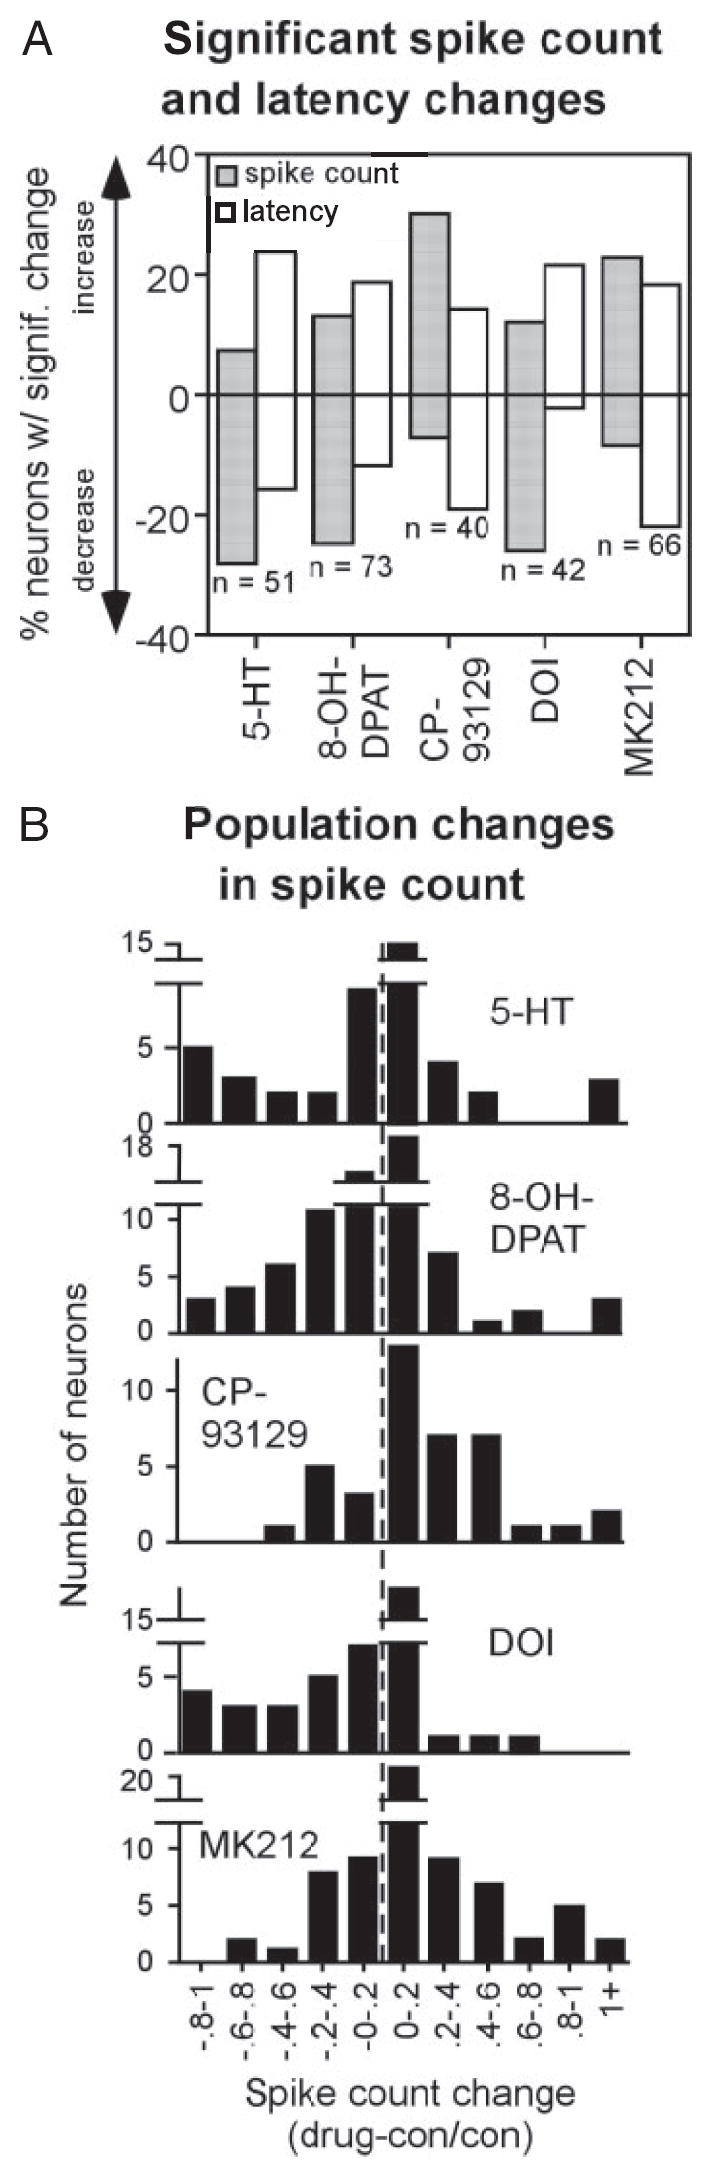
Effects of agonists in the neuron population. A: percentage of neurons showing significant increases or decreases in spike count (filled bars) and latency (open bars). Sample sizes represent all neurons exposed to a given agonist. B: histograms of the numbers of neurons showing agonist-evoked changes of different sizes for the 5 agonists, expressed as (drug-control)/ control spike counts. Dashed line represents no change in spike count.