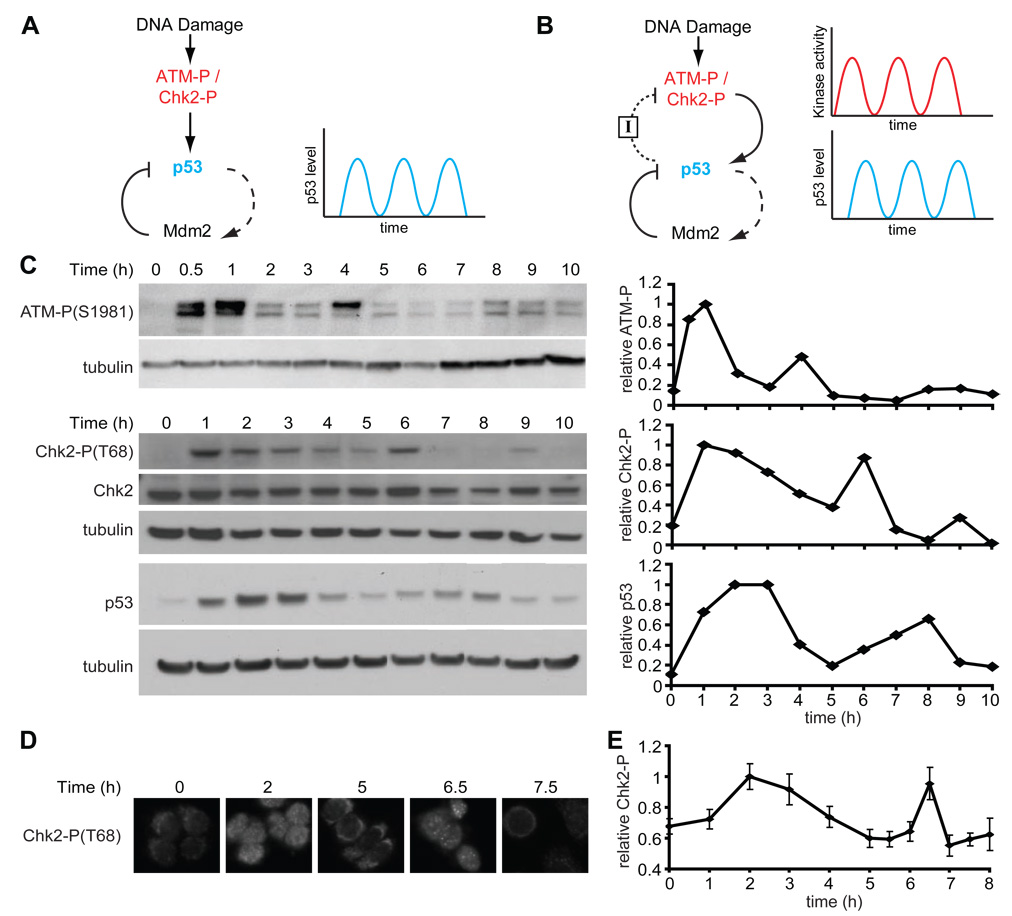
Figure 1. Dynamics of DNA damage kinases.
(A) In one class of previous models, repeated p53 pulses result from the negative feedback loop between p53 and Mdm2. In this model, DNA damage activates the p53-Mdm2 module through ATM and Chk2, and subsequent oscillation results from the timing delay between p53 upregulation and Mdm2 activation. Dashed lines correspond to slow rate responses (e.g. transcription). Solid lines correspond to fast rate responses (e.g. protein-protein interaction or phosphorylation). (B) In an alternative model, in addition to the p53-Mdm2 negative feedback loop, p53 creates a separate negative feedback loop with the upstream kinases ATM and Chk2 by upregulating an inhibitor, I. In this proposal, the signaling kinase activities may oscillate as well. The nature and rate of feedback between p53 and ATM through I is unknown. (C) Left: Immunoblots of ATM-P(S1981), Chk2-P(T68), and p53 kinetics in MCF7 cells irradiated with 10Gy of γ-irradiation. Right: protein quantification of the presented blots normalized by tubulin, in units relative to peak intensity. (D) Representative Chk2-P(T68) immunofluorescence images of MCF7 cells fixed at the indicated times after irradiation with 10Gy of γ-irradiation. (E) Quantification of the 10% brightest cells from Chk2-P(T68) immunofluorescence analysis. Bars = standard deviations. (n = 127 cells/time point)

